

Raydium (RAY) Is Having a Moment
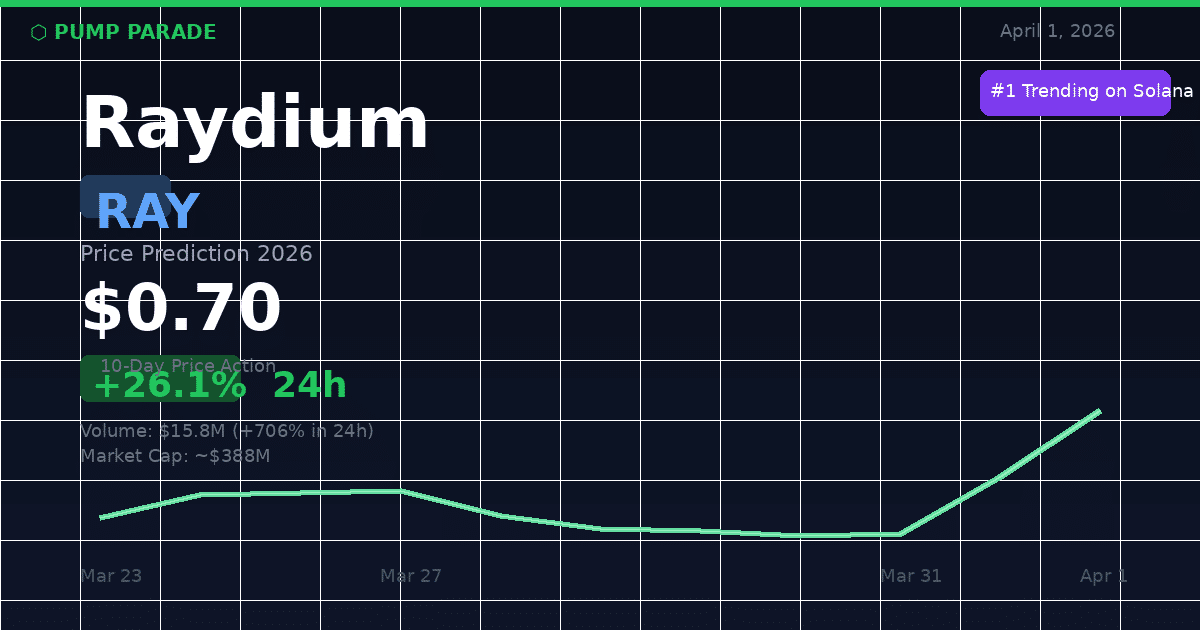
Raydium is up 26% today. Its trading volume just spiked 706% in 24 hours. And it’s sitting at the top of Birdeye’s trending list for the Solana ecosystem.
At time of writing, RAY is trading at $0.70, up from a recent low of $0.54 on March 29. That’s a 30% recovery in just three days. The question is whether this is a genuine trend reversal or a short-lived pump. Let’s look at the data.
What Is Raydium?
Raydium is one of Solana’s oldest and most important decentralized exchanges (DEXs). Think of it as the backbone of Solana’s trading infrastructure. It connects to Solana’s central order book and provides deep liquidity for thousands of token pairs.
RAY is the protocol’s native token. It’s used for staking, governance, and as a fee-sharing mechanism for liquidity providers. More importantly, a portion of platform fees are used to buy back RAY from the open market. That buyback mechanism is central to RAY’s value thesis.
Key metrics at time of writing:
- Price: $0.70
- 24h change: +26.1%
- 24h volume: $15.8M (up 706% from prior day)
- Market cap: ~$388M
- Liquidity (on-chain): $10M
What’s Driving the Surge?
Two things are behind RAY’s price action right now.
LaunchLab: Raydium’s Answer to Pump.fun
Raydium launched LaunchLab, its own token launchpad that competes directly with Pump.fun. The platform allows anyone to create and launch tokens using customizable bonding curves. Third-party platforms can set their own fees on top.
Here’s the part that matters for RAY holders: 25% of all LaunchLab fees go toward buying back RAY. Pump.fun had previously been routing $31.7B in trading volume through its own pools rather than Raydium’s. LaunchLab is designed to capture that revenue back.
Since launch, LaunchLab has already facilitated over 3,700 new token creations. Pump.fun still leads daily token generation with over 60% market share, but the gap is narrowing.
Broader Solana Ecosystem Momentum
Solana is trading at $83.32 today, with $12.2B in 24-hour volume across the ecosystem. When Solana heats up, its DeFi tokens tend to follow. Raydium sits at the center of that activity, capturing fees from every trade that flows through it.
If you want to understand where Solana is headed as a whole, check our Solana (SOL) price prediction for 2026 for full context on the network’s upgrade cycle.
Technical Analysis: What the Chart Says
RAY spent most of March consolidating between $0.56 and $0.62. That range held for nearly two weeks, building a solid base.
On March 31, the first breakout candle appeared. Volume jumped to 8.9M units, more than double the prior week’s average. Today (April 1), volume has already hit 16.8M units with the session still open. Price pushed as high as $0.74 intraday.
Here are the key levels to watch:
- Support: $0.56 to $0.58 (prior consolidation base)
- Secondary support: $0.62 (breakout level, now acting as floor)
- Resistance: $0.74 to $0.75 (today’s intraday high)
- Next resistance: $1.00 (psychological level)
- Major resistance: $2.33 to $2.50 (RAY’s previous post-announcement high)
The RSI on the 4-hour chart was running in neutral territory (45 to 50 range) before this breakout. That means the move started from an uncrowded position, not from an already overbought state. That’s a healthier setup than a spike from elevated RSI.
The 50-day moving average on the 4-hour chart has been rising since March 18. That’s the first sign of sustained short-term momentum building. On the daily chart, the 200-day moving average is still declining. Until that flips, the longer-term recovery hasn’t fully confirmed. That’s the key tension in this setup.
You can track RAY’s real-time price and volume data on Birdeye’s Raydium analytics page.
The Bull Case for RAY
The optimistic scenario rests on a few converging factors.
Revenue flywheel from LaunchLab. If LaunchLab captures even 20 to 30% of Pump.fun’s current daily volume, the fee revenue flowing back to RAY buybacks could be substantial. More buying pressure on a relatively small float pushes price up.
Perpetuals trading launch. Raydium has also launched a decentralized perpetuals trading platform. Perps are where the real fee volume lives in DeFi. Even a modest capture of Solana’s derivatives flow would move the needle for RAY.
Solana ecosystem recovery. SOL is still down roughly 50% from its all-time high. If SOL recovers toward the $150 to $200 range (as many analysts expect through 2026), ecosystem tokens like RAY historically outperform the underlying chain on percentage gains.
Historical context. When RAY had positive protocol momentum in late 2024 and early 2025, it traded above $5. That’s not a price target, it’s context. The protocol is more developed now, and the LaunchLab fee mechanism gives it a stronger fundamental anchor than it had then.
The Bear Case for RAY
The data also tells a more cautious story.
Pump.fun still dominates. Over 60% of new Solana token launches still go through Pump.fun. Until LaunchLab meaningfully dents that lead, the fee revenue thesis depends on an outcome that hasn’t happened yet.
Volume spikes can reverse fast. Today’s 706% volume increase is notable. But single-day volume explosions in mid-cap DeFi tokens often fade within 48 to 72 hours. If this is a short squeeze rather than a trend change, RAY could give back the gains quickly.
Daily chart weakness. The 200-day moving average on the daily chart is still declining. Until that flips, the longer-term trend remains in question. Any macro selloff in crypto could send RAY back toward the $0.54 to $0.56 support zone.
Competitor pressure. Meteora and Jupiter continue to gain liquidity share on Solana. Raydium’s dominance isn’t guaranteed in a competitive ecosystem.
AI Price Prediction Summary
Our hybrid AI model combines on-chain volume data, technical indicators, historical price patterns, and protocol revenue signals. Here’s what it outputs for RAY at current levels:
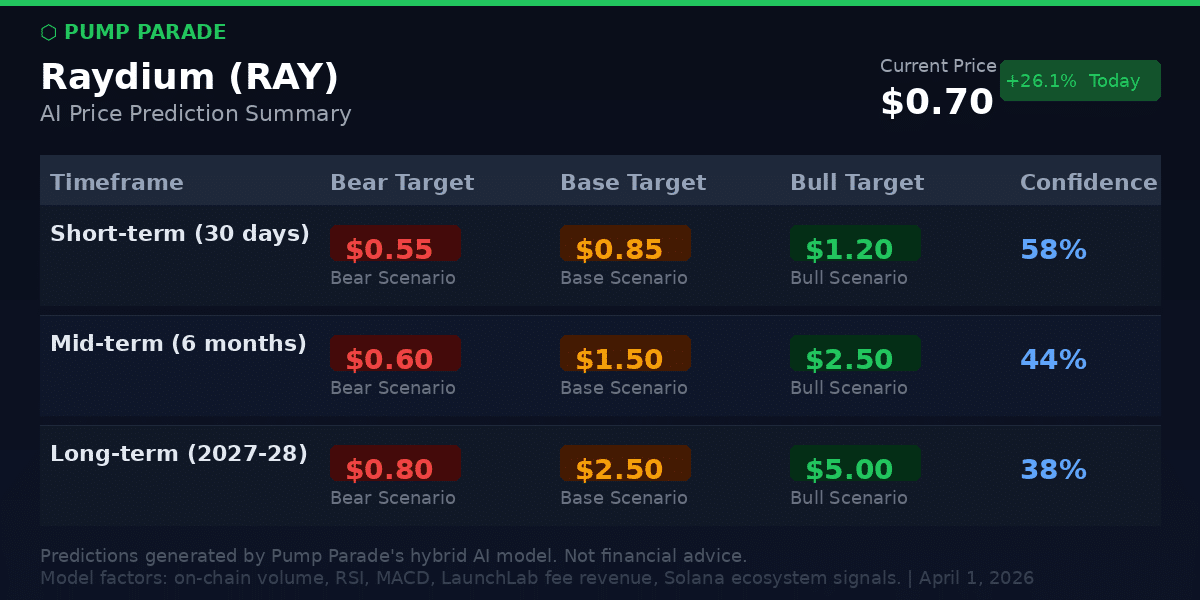
The model assigns a 58% probability that RAY tests the $1.00 level within 30 days if today’s volume trend persists through the week. It assigns a 35% probability that RAY pulls back to the $0.56 to $0.62 range before attempting another leg higher. The remaining 7% accounts for extreme scenarios in either direction.
For the medium and long term, the model’s base case assumes LaunchLab captures 15 to 20% of Solana launchpad volume by end of 2026. It also assumes the perpetuals platform generates meaningful fee revenue. Those assumptions drive the $1.50 to $2.00 medium-term range.
What to Watch
If you’re tracking RAY, here are the signals that matter:
- LaunchLab daily volume relative to Pump.fun. If LaunchLab crosses 30% market share, that’s a meaningful bull signal.
- RAY buyback data on-chain. More buybacks mean more genuine demand, not just speculative buying.
- $0.74 to $0.75 resistance. A daily close above this level with sustained volume would confirm the breakout is real.
- $0.56 support. A breakdown below this level on high volume would suggest the move was a false breakout.
- SOL price action. RAY is highly correlated to Solana’s broader trajectory. If SOL drops below $75, expect RAY to follow.
The Bottom Line
Raydium has a genuine catalyst behind today’s move. LaunchLab’s fee buyback mechanism gives RAY real fundamental support that didn’t exist six months ago. The perpetuals platform adds another potential revenue stream.
But this is still a mid-cap DeFi token on a chain that has its own volatility risks. Today’s 706% volume spike is exciting. It’s also a signal to be careful about chasing at the highs. The setup looks constructive if $0.62 holds as support on any pullback.
The bull case is data-backed. So is the bear case. Monitor the levels, watch the LaunchLab volume share, and size your position accordingly.
Disclaimer: This article is for informational and educational purposes only and should not be construed as financial, investment, or trading advice. Cryptocurrency markets are highly volatile, and past performance does not guarantee future results. The price predictions and analyses presented here are based on AI models, technical indicators, and available data at the time of writing. They are not guarantees. Always conduct your own research (DYOR) and consult with a qualified financial advisor before making any investment decisions. Pump Parade and its authors do not assume liability for financial losses incurred based on information provided in this article.
About our AI predictions: Pump Parade’s price predictions are generated by machine learning models that analyze technical indicators, on-chain data, and market sentiment. These models have limitations and cannot account for black swan events, regulatory changes, or sudden market shifts. Prediction confidence scores reflect the model’s internal assessment, not guaranteed accuracy. Use AI predictions as one input among many in your research.
