

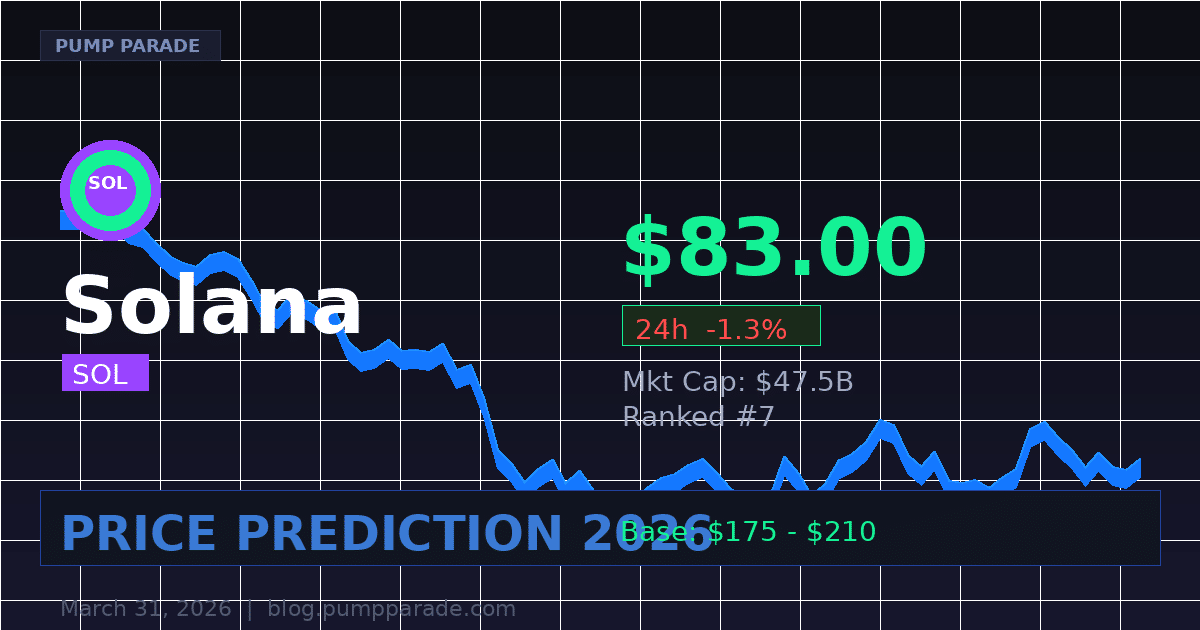
Solana is trading at $83.00 today, March 31, 2026. That’s down 71.7% from its all-time high of $293.31. For a network processing over $13 billion in daily volume on-chain, that gap between performance and price tells an interesting story.
The fundamentals are building. The Alpenglow upgrade is approaching, promising to cut transaction finality from 12 seconds to under 150 milliseconds. Solana ETFs have pulled in over $1.45 billion in cumulative inflows. Stablecoins on Solana have crossed $17 billion. And yet, SOL is sitting at $83.
Can Solana close that gap? Our AI model has been running the numbers. Here’s what the data says about where SOL could be headed in 2026 and beyond.
Solana at a Glance: Current Market Snapshot
Before the analysis, let’s anchor to the facts as of March 31, 2026:
- Price: $83.00 (Birdeye, real-time data)
- 24h Change: -1.3%
- Market Cap: $47.5 billion (ranked #7)
- Circulating Supply: 572.6 million SOL
- 24h Trading Volume: $3.3 billion
- All-Time High: $293.31
- Distance from ATH: -71.7%
The RSI (Relative Strength Index, a momentum indicator) sits around 40 to 46. That’s neutral territory, leaning slightly oversold. It’s not flashing a screaming buy signal, but it’s also nowhere near the overheated readings that marked previous tops.
What Is Solana? A Quick Overview
Solana is a Layer 1 blockchain built for speed and scale. It uses Proof of History (PoH) combined with Proof of Stake (PoS) to process thousands of transactions per second at near-zero fees.
The network has become the dominant home for memecoins, DeFi protocols, and on-chain trading. Its ecosystem now hosts over $17 billion in stablecoins. Institutional players including Fidelity and VanEck have launched Solana ETF products, and Goldman Sachs holds significant SOL exposure.
In plain terms: Solana is the blockchain that made on-chain trading accessible to a new generation of crypto participants. The infrastructure is fast, cheap, and battle-tested.
Key Catalysts Driving the 2026 Outlook
The Alpenglow Upgrade
This is the biggest technical development on Solana’s roadmap right now. Alpenglow is Solana’s largest core protocol change since launch. It replaces the existing consensus mechanism with a design targeting sub-150 millisecond finality for the entire network.
Currently, Solana achieves 12-second finality. Under Alpenglow, that drops to 150 milliseconds. That’s faster than many centralized servers. For trading applications, DeFi protocols, and payment use cases, this is a meaningful upgrade.
Multiple research desks have cited Alpenglow as a key catalyst for price targets in the $250 to $336 range by year-end 2026.
Solana ETF Inflows
Spot Solana ETF products have crossed $1.45 billion in cumulative inflows. Products from Bitwise (BSOL) and Fidelity (FSOL) have both seen significant traction. Goldman Sachs and Electric Capital now hold SOL exposure through these products.
This creates a structural demand floor that was absent in previous cycles. Institutional buyers don’t panic-sell the same way retail does. Their presence tends to compress downside volatility.
Stablecoin and DeFi Activity
Stablecoins on Solana have hit $17 billion. That’s a proxy for real economic activity on the network. When people move stablecoins on-chain, they’re usually trading, providing liquidity, or transacting.
Jupiter, Solana’s flagship DeFi aggregator, continues to route billions in daily swap volume. Raydium and Orca remain among the most active AMMs (Automated Market Makers, platforms that enable decentralized token swaps) in all of crypto.
Commodity Status and Regulatory Clarity
Solana has received de facto commodity classification in recent regulatory discussions. This reduces the legal overhang that weighed on the token for the past two years. Institutional allocators require that legal certainty before sizing positions. Now they have more of it.
Technical Analysis: What the Chart Is Saying
Here’s the current technical setup for SOL:
- Immediate support: $80 to $82 (tested twice in March 2026)
- Key support: $75 to $78 (break below this would be a bearish signal)
- Immediate resistance: $92 to $95 (concentrated sell pressure in this zone)
- Major resistance: $100 (psychological level with heavy overhead supply)
- RSI: 40 to 46 (neutral, not overbought)
Recent price action shows SOL bouncing from the $80 support level. A confirmed weekly close above $95 could open the path toward $100 and higher. But a break below $78 would likely push price toward the $67 range.
The broader trend since late 2024 has been lower highs and lower lows. That structure needs to break before the bull case fully opens. The Alpenglow deployment could be the catalyst that breaks the pattern.
The Bull Case for SOL in 2026
The bull case rests on three pillars: technical execution, institutional demand, and narrative momentum.
If Alpenglow ships on schedule and performs as designed, Solana would become the fastest finality chain at scale. That’s a real product upgrade. Developers building latency-sensitive applications would have a clear reason to build on Solana over competitors.
On the institutional side, ETF inflows at $1.45 billion and rising suggest real allocator demand. If total ETF assets under management approach $3 to $5 billion by late 2026, the structural buying pressure could push prices significantly higher.
Multiple analysts target $250 to $336 for SOL by end of 2026. The average across seven independent research desks sits at $425, with a range spanning $200 to $1,000. That wide range reflects genuine uncertainty, but the direction is clear: most analysts see meaningful upside from here.
The Bear Case: What Could Go Wrong
The bear case is real and shouldn’t be dismissed.
First, the technical structure is still bearish. Lower highs since the $293 peak, a series of failed recoveries at the $100 level, and no weekly bullish reversal signal yet. Price can stay depressed longer than expected even when fundamentals improve.
Second, macro risk. Crypto moves with broader risk appetite. A significant equity market correction in 2026 would not leave SOL unaffected. A 20% drop in major indices could push SOL back toward $55 to $65.
Third, competition. Ethereum is recovering. Base, Arbitrum, and Sui are all competing for the same developers and users. Solana’s share of DeFi TVL (Total Value Locked, the amount of capital deployed in DeFi protocols) has grown, but it’s not guaranteed to hold.
Fourth, upgrade risk. Technical upgrades can be delayed, bugged, or fail to generate the expected price response even when they ship. Markets sometimes buy the rumor and sell the news.
Key level to watch on the downside: a weekly close below $75 would target the $55 to $60 range.
AI Price Prediction Summary: SOL in 2026 and Beyond
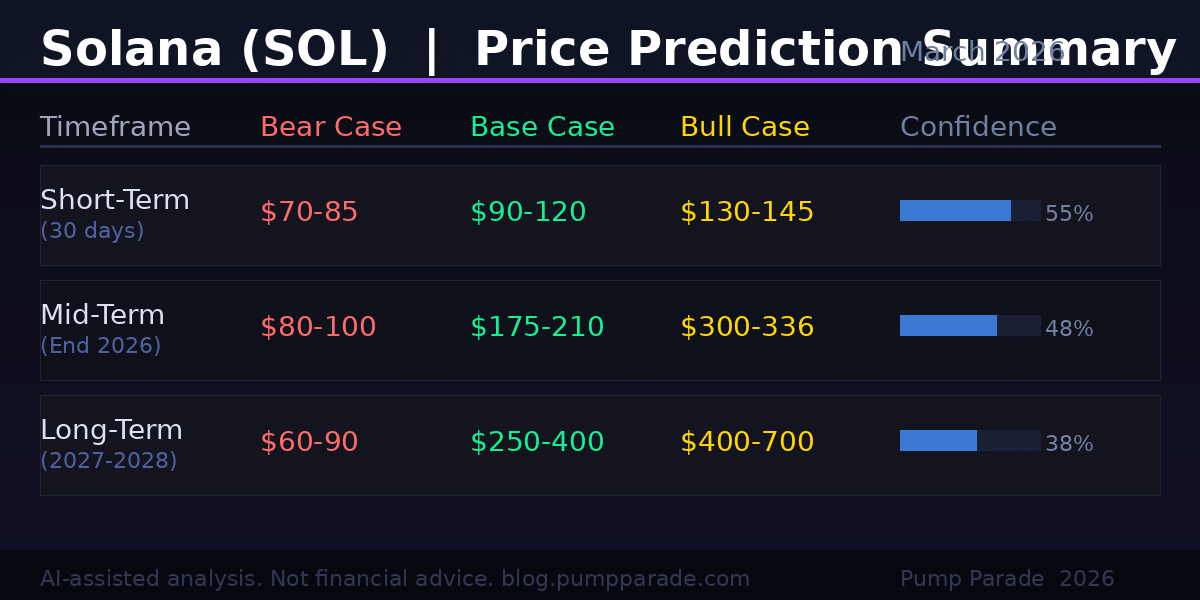
Our hybrid AI model draws on technical indicators, on-chain data, ETF flow trends, and historical cycle patterns. Here are the predictions for SOL across three time horizons as of March 31, 2026:
Short-Term (April to June 2026)
The model assigns a 55% probability to SOL trading in the $90 to $120 range by end of Q2 2026. The base case target is $105. The bear scenario keeps SOL in the $70 to $85 range. The bull scenario, triggered by early Alpenglow deployment or a broader market rally, puts SOL at $130 to $145.
Mid-Term (End of 2026)
By year-end 2026, the base case is $175 to $210. That assumes Alpenglow ships, ETF inflows continue at a moderate pace, and the broader market trades sideways to up. The bear case is $80 to $100. The bull case, requiring significant institutional acceleration, puts SOL at $300 to $336.
Long-Term (2027 to 2028)
Over a two-year horizon, the range widens considerably. The bear case: $60 to $90. The base case: $250 to $400. The bull case: $400 to $700, with some institutional models reaching $1,000 if Solana captures a dominant share of global on-chain activity.
The model’s confidence is moderate (62%) in the base case direction but low in specific price points. This is normal for 24-month crypto predictions. Use these as scenario frames, not forecasts.
For more ways to navigate the Solana ecosystem, including how to find high-potential tokens before they move, check out our guide on Solana memecoins and how to find massive moonshots.
Key Levels and Catalysts to Watch
Here’s what matters most for SOL over the next 90 days:
- Above $95: Opens the door to $100 and beyond. Watch for volume confirmation.
- Above $100: First major structural break. Signals a potential trend reversal.
- Below $78: Bearish signal. Could accelerate toward $67.
- Below $65: Deep bear scenario. Major reassessment required.
Dates to watch: the Alpenglow upgrade deployment timeline (no hard date confirmed as of writing), SEC decisions on pending Solana ETF applications, and Q1 2026 on-chain activity reports from major analytics platforms.
The Bottom Line
Solana at $83 in March 2026 is a network that has built serious infrastructure and attracted real institutional capital. The price hasn’t caught up to the fundamentals yet. The Alpenglow upgrade is the clearest near-term catalyst. ETF inflows provide a structural demand floor.
The base case by end of 2026 is $175 to $210. The upside scenario is $300. The downside is a return to the $70s or worse if the broader market turns against risk assets.
This isn’t a call to buy or sell. It’s a framework. The data is in front of you.
Current SOL price data sourced from CoinGecko.
Disclaimer: This article is for informational and educational purposes only and should not be construed as financial, investment, or trading advice. Cryptocurrency markets are highly volatile, and past performance does not guarantee future results. The price predictions and analyses presented here are based on AI models, technical indicators, and available data at the time of writing. They are not guarantees. Always conduct your own research (DYOR) and consult with a qualified financial advisor before making any investment decisions. Pump Parade and its authors do not assume liability for financial losses incurred based on information provided in this article.
About our AI predictions: Pump Parade’s price predictions are generated by machine learning models that analyze technical indicators, on-chain data, and market sentiment. These models have limitations and cannot account for black swan events, regulatory changes, or sudden market shifts. Prediction confidence scores reflect the model’s internal assessment, not guaranteed accuracy. Use AI predictions as one input among many in your research.
