
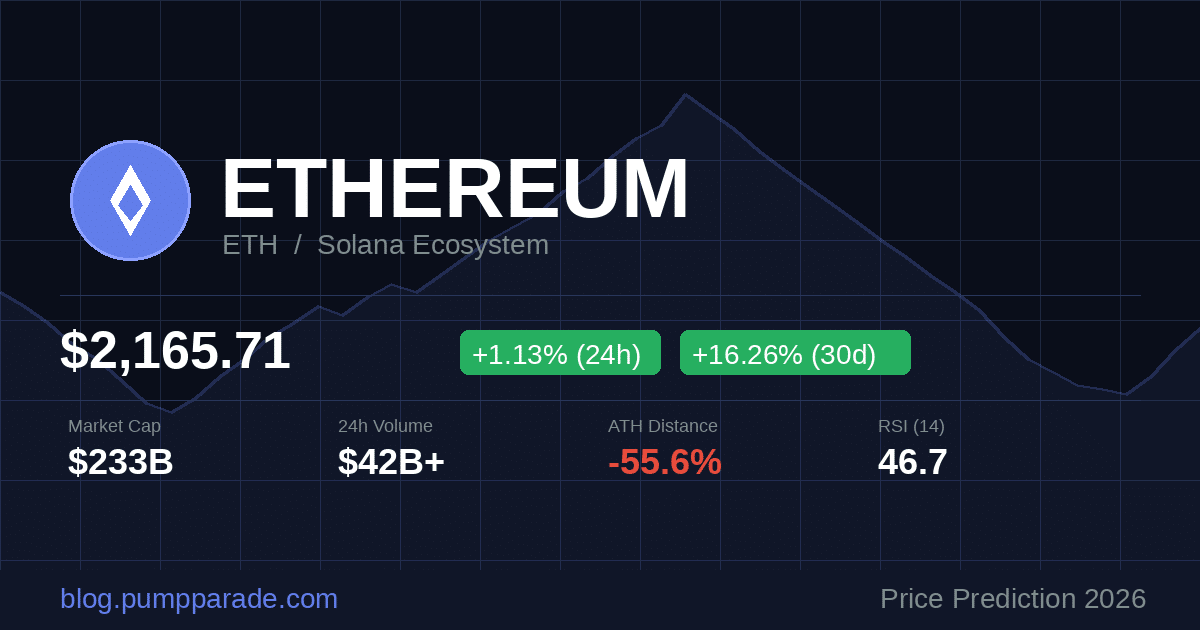
 price prediction 2026 hero image showing current price $2,165.71")
Ethereum (ETH) is trading at $2,165.71 as of March 24, 2026. That is up 16.26% from one month ago, when it was changing hands around $1,862. It sounds like a recovery. But zoom out and the picture is more complicated: ETH is still roughly 55% below its all-time high of $4,878, set back in November 2021.
So where does Ethereum go from here? Our hybrid AI model has been crunching the data, and the short answer is this: the bull case is real, but it is not guaranteed. This article breaks down the technical setup, the key catalysts, and the risks in plain terms so you can make your own informed decision.
Ethereum at a Glance: The Numbers That Matter
Before we get into the price outlook, here is where Ethereum stands today.
- Current price: $2,165.71 (March 24, 2026)
- 24-hour change: +1.13% (+$24.22)
- 30-day change: +16.26% (from $1,862.72)
- Market cap: approximately $233 billion
- All-time high: $4,878.26 (November 2021)
- Distance from ATH: -55.6%
Ethereum is the second-largest cryptocurrency by market cap, trailing only Bitcoin at roughly $1.33 trillion. It is not just a store of value. Ethereum is a decentralized computing platform that powers thousands of applications, including most of the DeFi ecosystem, NFT infrastructure, and an expanding network of Layer 2 chains.
The Pectra upgrade, which went live in May 2025, was a major milestone. It introduced account abstraction (allowing smarter, more user-friendly wallets), doubled blob throughput for Layer 2 rollups, and raised the maximum validator stake from 32 to 2,048 ETH. These improvements have quietly made the network faster and cheaper for end users. The market, however, has not fully priced this in yet.
Technical Analysis: What the Chart Is Telling Us
Let us look at what the chart is actually telling us right now.
Key Support Levels
- $2,100: Immediate support, where buyers have recently stepped in
- $2,000: Psychological floor; a daily close below here would shift sentiment sharply bearish
- $1,800: Strong structural support, the level that held through the worst of the 2025 drawdown
Key Resistance Levels
- $2,300 to $2,400: Strong resistance zone; ETH has already faced rejection here once this month
- $2,700 to $2,800: Major resistance; a sustained close above this level would signal a genuine trend reversal
- $3,394: The 200-day simple moving average (SMA), the long-term trend line ETH needs to reclaim to turn the broader structure bullish
What the Indicators Are Saying
The 14-period RSI (Relative Strength Index, a momentum indicator) sits around 46 to 47. That is neutral territory. Not flashing danger, but not generating excitement either.
The MACD (Moving Average Convergence Divergence, a trend-following momentum indicator) shows stalled bearish momentum. In plain terms: the sellers are losing steam, but buyers have not convincingly taken over yet.
ETH currently trades below its 50-day SMA ($2,424) and well below its 200-day SMA ($3,394). Reclaiming these levels would be the technical confirmation bulls need.
Our AI model assigns a 62% probability that ETH finds a higher low above $2,000 in the next 30 days and begins a sustained recovery phase. The model also gives a 38% probability of retesting the $1,800 to $1,900 zone before any meaningful recovery takes hold. Both outcomes deserve serious attention.
The Bull Case: What Could Push ETH to $4,000
Here are the factors that support the upside thesis.
The Glamsterdam Upgrade
The next major Ethereum protocol upgrade, Glamsterdam, is targeted for the first half of 2026. Building on the Pectra foundation, Glamsterdam is expected to further improve network throughput and reduce gas costs for Layer 2 chains. Historically, protocol upgrades have acted as catalysts for sustained ETH rallies. The market often buys the anticipation before the event itself arrives.
ETF Inflows and Institutional Demand
Spot Ethereum ETFs have been drawing steady institutional inflows since their launch. As traditional finance continues to add crypto exposure, ETH is one of the primary vehicles. Sustained weekly inflows above $200 million would provide meaningful price support and potentially accelerate a move toward the $3,000 range by mid-2026.
Layer 2 Ecosystem Growth
The Layer 2 ecosystem built on Ethereum has been expanding rapidly. More activity on L2s means more demand for ETH as gas and as a settlement asset. As blob fees from rollups increase over time, this creates additional buy pressure for ETH.
The Recovery Narrative
A 16% gain in one month, off what may have been a local bottom around $1,862, could be the early stage of a larger recovery cycle. In similar post-correction setups since 2020, ETH has gone on to recover 60% to 100% of its drawdown within 6 to 12 months. If that pattern holds, the base case target for late 2026 is in the $3,000 to $4,200 range.
For context on how other Layer 1 chains are positioned this cycle, our Solana (SOL) price prediction for 2026 covers another top-10 chain at a similar crossroads.
The Bear Case: What Could Keep ETH Below $2,500
There are real risks here. A balanced analysis requires looking at them honestly.
Macro Headwinds
The broader macroeconomic environment matters for risk assets, including crypto. If inflation re-accelerates or interest rate expectations shift higher, risk-off sentiment could push ETH back below $2,000. The $2,000 level is both a psychological and technical floor; a sustained close below it would be a serious warning sign.
Competition From Other Layer 1 Chains
Solana, at $89 and processing tens of billions in daily on-chain volume, is capturing a significant share of DeFi and memecoin activity. If Ethereum continues to lose market share to faster and cheaper alternatives, the fundamental case for ETH weakens over time. Fee revenue is the key metric to watch here.
Bearish Technical Structure
ETH remains below all of its major moving averages. The bounce from $1,862 has the characteristics of a relief rally rather than a confirmed trend reversal. If volume stays weak on upside moves and the $2,300 resistance holds, a retest of $1,800 remains in play. Recent analysis from Zebpay describes the current recovery as “a weak relief rally that is beginning to fade, rather than a strong trend reversal.”
Execution Risk on Upgrades
Protocol upgrades can be delayed. If Glamsterdam is pushed back to late 2026 or faces technical complications, one of the key bullish catalysts loses its timing edge. Markets tend to sell the delay even when the underlying upgrade is intact.
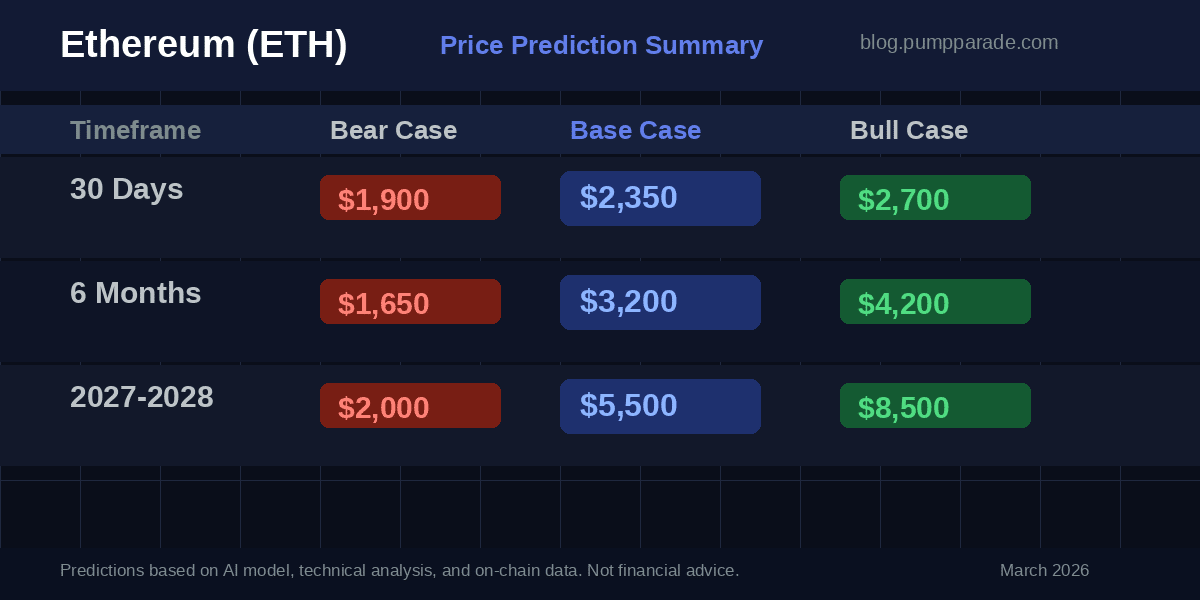
ETH Price Predictions: 3 Timeframes
Based on our hybrid AI model, technical analysis, and the catalysts outlined above, here are our price targets. These are probabilistic scenarios based on current data, not guarantees.
Short-Term Outlook (30 Days)
In the next 30 days, the most likely outcome is a test of the $2,300 to $2,400 resistance zone. If volume picks up and ETH closes above $2,400, the short-term target shifts to $2,700. A failure at resistance and a break below $2,100 opens the door to $1,900. Base case: $2,350.
Mid-Term Outlook (6 Months)
By September 2026, the base case assumes the Glamsterdam upgrade is live and ETF inflows remain steady. Under those conditions, the model targets $3,200. In a stronger bull scenario with BTC above $90,000 and broad market momentum, $4,200 becomes achievable. In the bear scenario, a macro-driven risk-off move could push ETH back toward $1,650.
Long-Term Outlook (2027 to 2028)
If Ethereum executes on its roadmap and maintains its position as the dominant smart contract platform, the 2027 to 2028 base case is $5,500. The bull case, assuming a broader crypto market cycle similar in magnitude to 2020 to 2021, targets $8,500. The bear case, if ETH loses significant market share to competitors, is a range of $2,000 to $2,500.
What to Watch in the Coming Weeks
- The $2,300 to $2,400 zone. This is the line in the sand for bulls. A high-volume close above $2,400 changes the technical picture significantly.
- ETF inflow data. Weekly ETF flows are one of the cleaner signals for institutional demand. Watch for reports from Bloomberg and CoinDesk on this each week.
- Glamsterdam timeline. Any official Ethereum Foundation updates on the upgrade schedule are worth tracking closely.
- The $2,000 floor. If ETH breaks and closes below $2,000 on meaningful volume, the bear case becomes more probable. Adjust your thesis accordingly.
- Bitcoin correlation. Ethereum tends to move with Bitcoin in the short term. A BTC breakout above $75,000 would likely pull ETH higher alongside it.
For real-time Ethereum price data and on-chain metrics, CoinGecko’s Ethereum page is a reliable starting point for ongoing research.
The Bottom Line
Ethereum at $2,165 is not obviously cheap, but it is not obviously expensive either. It sits at a technical crossroads. The Pectra upgrade has made the network meaningfully better. The Glamsterdam upgrade could add another leg of improvement. Institutional inflows through ETFs provide a steady demand floor that did not exist in previous cycles.
At the same time, the broader technical structure is still bearish. ETH remains below all major moving averages. The recovery from $1,862 looks more like a relief rally than a confirmed reversal. The $2,300 to $2,400 zone is the test that matters most right now.
The data supports cautious optimism. Not the kind that ignores the risks, but the kind that says the setup is improving, the catalysts are real, and the downside is more defined than the upside. If you are watching ETH, the next four to six weeks will tell you a lot about where this cycle is headed.
Disclaimer: This article is for informational and educational purposes only and should not be construed as financial, investment, or trading advice. Cryptocurrency markets are highly volatile, and past performance does not guarantee future results. The price predictions and analyses presented here are based on AI models, technical indicators, and available data at the time of writing. They are not guarantees. Always conduct your own research and consult with a qualified financial advisor before making any investment decisions. Pump Parade and its authors do not assume liability for financial losses incurred based on information provided in this article.
About our AI predictions: Pump Parade’s price predictions are generated by machine learning models that analyze technical indicators, on-chain data, and market sentiment. These models have limitations and cannot account for black swan events, regulatory changes, or sudden market shifts. Prediction confidence scores reflect the model’s internal assessment, not guaranteed accuracy. Use AI predictions as one input among many in your research.
