

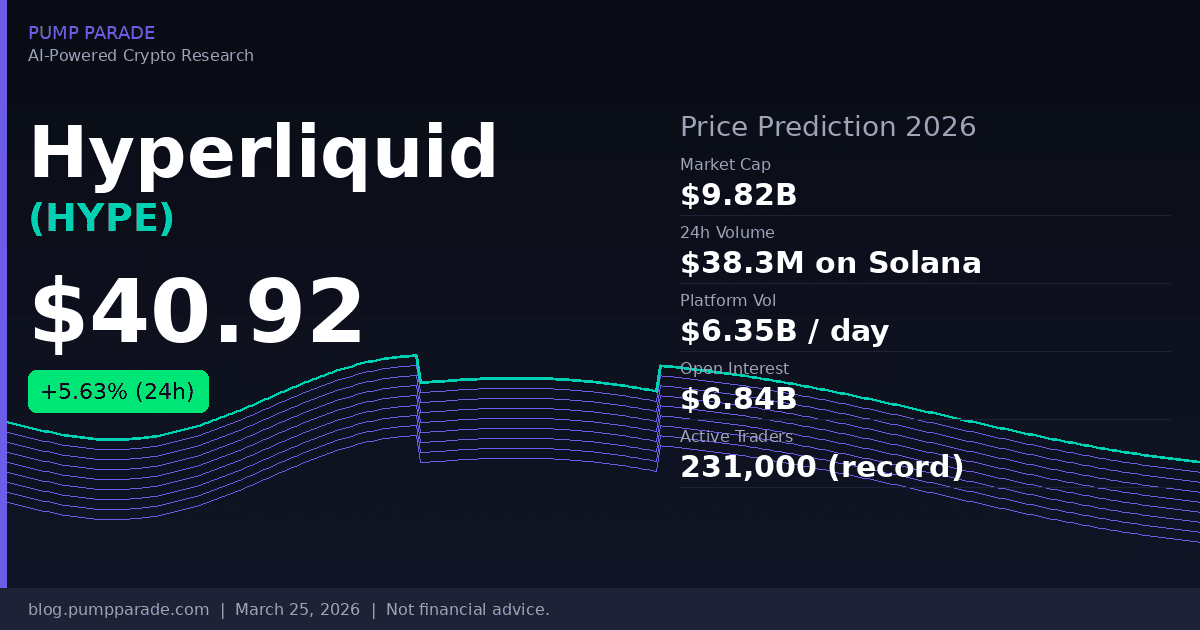
Hyperliquid’s HYPE token is trading at $40.92 as of March 25, 2026 , up 5.63% in 24 hours and more than 100% above its January low of $20. The platform just hit a record 231,000 active perpetual traders. Multiple asset managers have filed for spot HYPE ETFs with the SEC. This isn’t a quiet week for HYPE.
The question on every DeFi trader’s mind right now: can HYPE break above $50 and sustain a new all-time high? Or does the token’s supply unlock schedule and competitive pressure cap the upside? Our hybrid AI model breaks down both paths.
What Is Hyperliquid?
Hyperliquid is a high-performance Layer 1 blockchain built specifically for on-chain perpetual futures trading. It runs on HyperBFT, a custom consensus mechanism that delivers sub-second transaction finality with no KYC requirements.
Think of it as a decentralized alternative to Binance’s futures exchange. But it runs entirely on-chain, with no off-chain matching engines or hidden order books.
The platform has processed over $4.1 trillion in cumulative volume since launch. That puts it comfortably ahead of most centralized competitors in raw throughput. Today, it handles $6.35 billion in daily trading volume with $6.84 billion in open interest across all markets.
The HYPE token governs the protocol and captures value through a flywheel mechanism: 97% of protocol fees fund automated HYPE buybacks. The protocol generates over $2.5 million per day in revenue, which has fueled roughly $1.7 billion in cumulative buybacks and burns to date.
The HIP-3 Catalyst: Real-World Assets on Hyperliquid
The biggest story on Hyperliquid right now isn’t crypto pairs. It’s oil, silver, and the S&P 500.
The HIP-3 protocol upgrade enabled permissionless creation of perpetual markets for real-world assets (RWAs). Traders can now go long or short crude oil, gold, silver, and index futures, all settled on-chain and trading 24/7.
The numbers are staggering. During peak Hormuz crisis volatility in early March, WTI crude oil perpetuals processed over $5 billion in volume in 72 hours. Weekend oil trading volumes exceeded $1.4 billion on some days. Silver perpetuals hit a peak daily volume of $4.67 billion on weekdays.
HIP-3 open interest reached an all-time high of $1.74 billion on March 23, a 25% jump from the prior week. Real-world asset markets now represent approximately 30-46% of Hyperliquid’s total volume, depending on the day.
S&P Dow Jones Indices officially licensed the S&P 500 perpetual contract to Trade[XYZ], a Hyperliquid-native platform. That contract exceeded $100 million in 24-hour volume within days of its debut. Hyperliquid is beginning to look less like a crypto DEX and more like a 24/7 global derivatives exchange.
For broader context on the DeFi competitive landscape, our Ethereum (ETH) price prediction for 2026 covers how purpose-built chains are challenging Ethereum’s dominance across DeFi. Hyperliquid is exhibit A in that story.
Key Metrics at a Glance
- Current price: $40.92 (March 25, 2026, per Birdeye)
- 24h change: +5.63%
- Market cap: ~$9.82 billion (top 10 globally)
- YTD high: $43
- January low: $20
- Daily trading volume on platform: $6.35B
- Total open interest: $6.84B
- Active traders: 231,000 (record)
- Cumulative protocol volume: $4.1 trillion
Technical Analysis: Where HYPE Stands Right Now
HYPE has more than doubled from its January low of $20. That’s a sharp recovery. But it’s still about 5% below the year-to-date high of $43.
Here’s what the chart is telling us right now.
Support: The $35 level has held firm as support through two tests in February and March. A daily close below $35 would be a red flag for the near-term thesis.
Resistance: $43 is the immediate ceiling, matching the YTD high. A clean break above $43 on strong volume opens the path to $50. Multiple analysts and fresh coverage published this week identify $50 as the next major resistance zone.
RSI (Relative Strength Index): The 14-day RSI sits in the 62-65 range, indicating positive momentum but not yet overbought. There is room to run before hitting overbought territory above 70.
MACD (Moving Average Convergence Divergence): The daily MACD is showing a bullish crossover, with the signal line turning positive for the first time since late January. That’s a constructive setup.
Moving averages: HYPE is trading above both the 50-day and 200-day moving averages. The 50-day is curling upward, a classic accumulation signal in trending assets.
Based on our hybrid AI model, the probability of HYPE testing $50 within 30 days is approximately 58%, conditional on Bitcoin holding above $80,000 and no major negative macro surprises.
The Bull Case for HYPE in 2026
Three catalysts could push HYPE significantly higher over the next 6-12 months.
1. Spot ETF approval. Grayscale, Bitwise, and 21Shares have all filed for spot HYPE ETFs with the SEC. If even one gets approved, it creates a structural, non-leveraged buyer with persistent demand. ETF flows into Bitcoin and Ethereum meaningfully repriced both assets after their approvals. A HYPE ETF could do the same.
2. RWA perpetuals flywheel. As more real-world asset markets come online and deepen in liquidity, Hyperliquid captures a larger share of global derivatives volume. The platform already handles 24/7 oil and silver trading that traditional exchanges can’t match. If institutional traders migrate to on-chain perpetuals, the addressable market expands dramatically.
3. Buyback compression. With 97% of daily revenue funding HYPE buybacks, the protocol removes supply at a rate that scales with usage. More volume means more fees. More fees means more HYPE removed from circulation. At current revenue run rates, that’s roughly $2.4 million in daily buy pressure. If volume grows, that pressure compounds.
The bull target in this scenario: $110-$130 by end of 2026, implying a market cap of $28-$33 billion. That’s aggressive but not unreasonable if Hyperliquid sustains its position as the dominant on-chain derivatives platform.
The Bear Case: What Could Go Wrong
The bear case centers on supply dynamics and competitive pressure.
Token unlocks. Core contributor tokens representing approximately 23.8% of total supply unlock on a monthly schedule through 2027 and 2028. Even if buybacks absorb some of that supply, sustained unlock pressure can cap price appreciation. The net supply equation needs to favor buyers for the token to grind higher.
Leverage and open interest concentration. At $6.84 billion in open interest, Hyperliquid’s market is heavily leveraged. A sharp move in any direction could trigger cascading liquidations, causing the token price to overshoot to the downside. This happened in February. It can happen again.
Regulatory risk. Hyperliquid operates without KYC. That has attracted users, but it has also attracted regulatory scrutiny. Any adverse SEC or CFTC action targeting permissionless derivatives platforms would be a significant headwind.
Competition from centralized exchanges. Binance, Bybit, and OKX are not standing still. If centralized exchanges improve their on-chain offerings or launch competing Layer 1 networks, Hyperliquid’s volume advantage could narrow.
The downside scenario: $22-$28 by year-end 2026 if token unlocks overwhelm buyback demand and macro conditions deteriorate.
AI Price Prediction Summary
Our hybrid AI model analyzed technical indicators, on-chain revenue data, token supply dynamics, and historical comparable setups to generate the following price targets. These are scenarios, not guarantees.
Note: HYPE current price is $40.92 at time of writing (March 25, 2026). All targets are scenario-dependent.
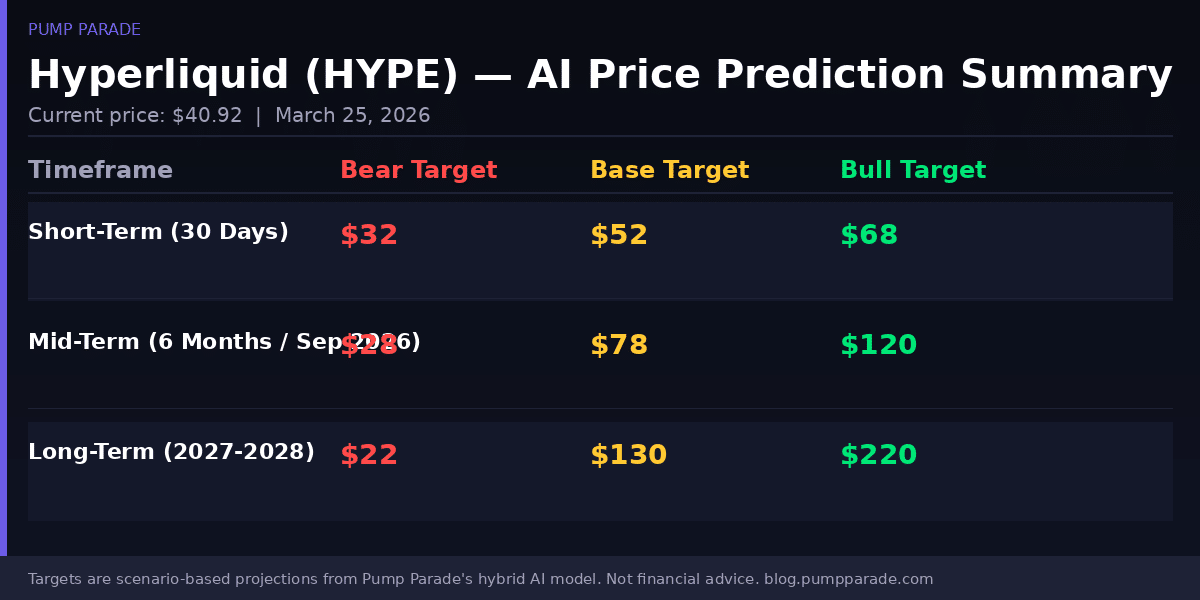
Short-Term (Next 30 Days)
Bear target: $32 | Base target: $52 | Bull target: $68
The most likely near-term path is a test of the $43 YTD high, followed by a breakout attempt toward $52. If that fails, a pullback to $35 support is the most probable outcome. The 30-day model assigns a 58% probability to the base case.
Mid-Term (6 Months, by September 2026)
Bear target: $28 | Base target: $78 | Bull target: $120
The mid-term thesis depends heavily on ETF approval timing and whether RWA volume growth continues compounding. A successful ETF launch shifts the base case toward the bull range. Token unlock pressure is the primary risk to the downside.
Long-Term (2027-2028)
Bear target: $22 | Base target: $130 | Bull target: $220
The long-term outlook for HYPE is binary. Either Hyperliquid becomes the dominant global on-chain derivatives exchange, in which case a $30-50 billion market cap is defensible, or competition or regulation erodes its edge, and the token retraces toward earlier support levels.
What to Watch
Four things to monitor over the next 30-90 days:
- $43 resistance: A daily close above $43 on above-average volume is the signal that the next leg is underway.
- SEC ETF decisions: Any approval or denial on the 21Shares, Bitwise, or Grayscale HYPE ETF filings will move the price sharply.
- Monthly net supply: Track whether buybacks are outpacing contributor token unlocks. If net supply is shrinking, the buyback flywheel is working.
- RWA open interest: If HIP-3 open interest continues growing past $2 billion, it validates the thesis that Hyperliquid can capture a slice of traditional derivatives markets.
You can track HYPE’s live on-chain data, including volume and open interest, directly on CoinGecko’s Hyperliquid page.
Disclaimer: This article is for informational and educational purposes only and should not be construed as financial, investment, or trading advice. Cryptocurrency markets are highly volatile, and past performance does not guarantee future results. The price predictions and analyses presented here are based on AI models, technical indicators, and available data at the time of writing. They are not guarantees. Always conduct your own research (DYOR) and consult with a qualified financial advisor before making any investment decisions. Pump Parade and its authors do not assume liability for financial losses incurred based on information provided in this article.
About our AI predictions: Pump Parade’s price predictions are generated by machine learning models that analyze technical indicators, on-chain data, and market sentiment. These models have limitations and cannot account for black swan events, regulatory changes, or sudden market shifts. Prediction confidence scores reflect the model’s internal assessment, not guaranteed accuracy. Use AI predictions as one input among many in your research.
