
")
I was always skeptical about technical analysis. To me, predicting human behavior by staring at charts and drawing lines sounded like magical thinking.
Every time I tried to learn, I ended up with ten different interpretations for the same chart. And somehow, every “expert” I followed was certain of a different thing.
Personally, I was convinced technical analysis was useless. Inevitably, I’d make trades based purely on hype, Twitter chatter, or whichever token had a funny meme going around.
But that didn’t work either.
However, traders who understand technical analysis seem absolutely convinced it’s the best method to trade crypto. That said, how can it be so hard to learn, understand, and ultimately implement?
So, I decided to develop an AI tool that makes technical analysis faster, easier, and most importantly, more understandable.
Here’s how Pump Parade’s AI technical analysis tool works, how you can use it, what it does (and doesn’t do) and a special, incredibly valuable use case you can access with it.
Let’s dive in.
How the Technical Analysis Tool Works
Once I had the initial framework working, I started to see patterns I hadn’t noticed before. Not just in tokens, but in how technical indicators told a story together.
Individually, each one can be noisy. But when layered correctly, they reveal trends and momentum shifts that are hard to spot by eye.
Here’s how the AI engine processes each indicator to produce an analysis:
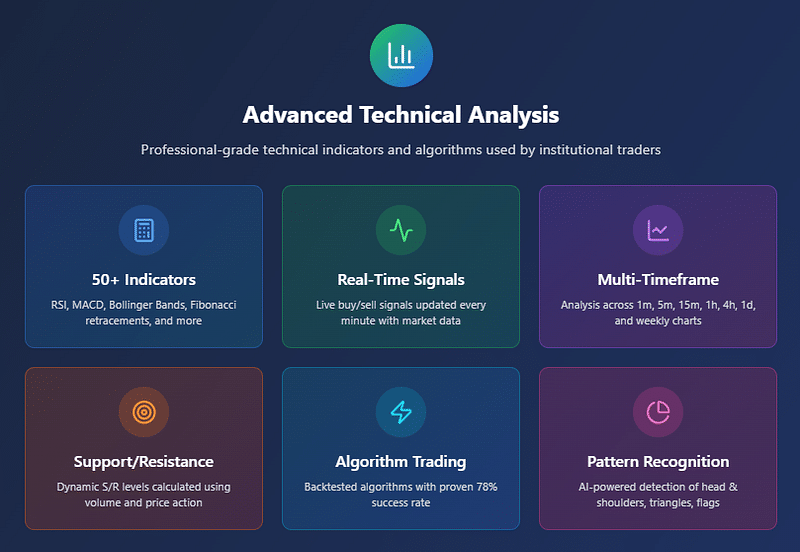
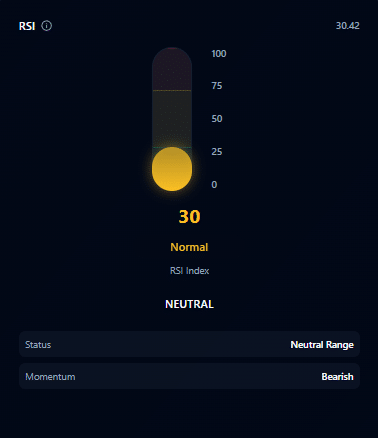
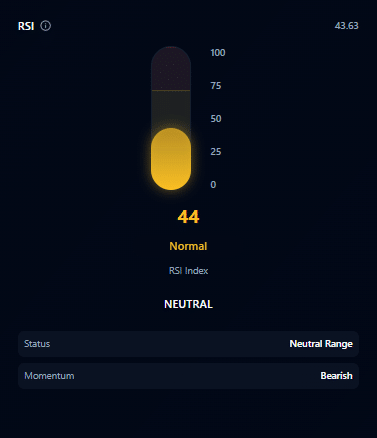
- RSI (Relative Strength Index): To measure momentum and identify overbought or oversold conditions.
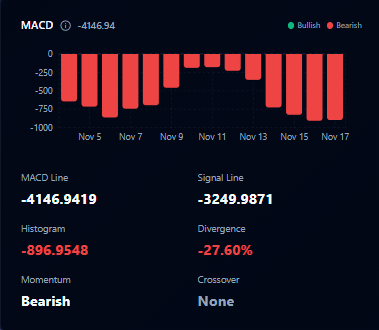
- MACD (Moving Average Convergence Divergence): To spot trend reversals and confirm momentum shifts.
- 20-Day Moving Average: To smooth short-term noise and see the underlying trend.
- Volatility: To understand how wild price swings were and quantify risk.
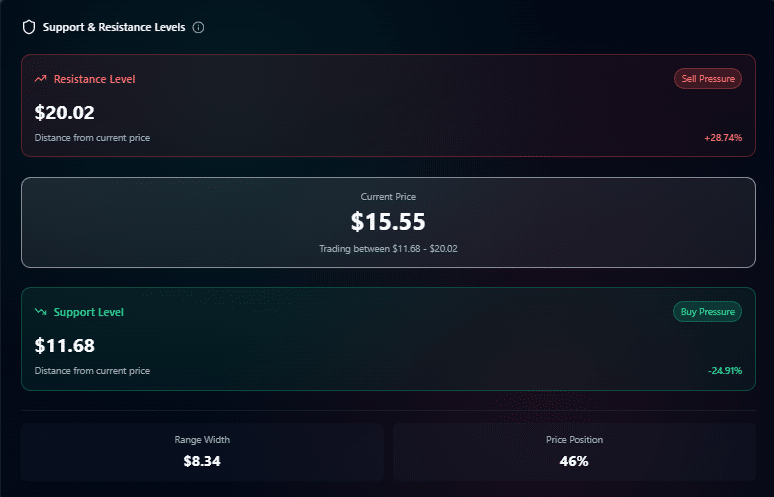
- Support and Resistance: To identify realistic price floors and ceilings.
- Linear Regression Slope: To track trend strength and momentum over time.
Click here and start analyzing over 1,000 tokens with Pump Parade’s AI Technical Analysis tool!
Why This Changed Everything
Before building this engine, my approach to crypto trading was noisy, emotional, and reactive.
I would chase pumps, fear dumps, and convince myself that something felt right because of hype. It was purely hope-based trading without any logical foundation whatsoever.
After all, I didn’t really understand technical analysis, so it was my only choice.
With Pump Parade’s AI engine, I could step back and say:
- Is this token overbought or oversold? (RSI)
- Is the trend genuinely gaining or losing momentum? (Slope + MACD)
- Are the recent highs and lows meaningful? (Support & Resistance)
- How risky is this move based on historical swings? (Volatility)
Which ultimately led to the question that actually mattered:
Should I buy this token now?
The insight wasn’t in predicting the future, it was in understanding the present, seeing the market for what it actually was, not what I wanted it to be.
And that clarity alone is invaluable.
Eager to get started? Try Pump Parade’s AI Technical Analysis tool on Bitcoin, Ethereum, Solana and more than 1,000 tokens!
Lessons Learned from Building It
Working on the crypto AI engine taught me a few lessons I hadn’t expected. Lessons that helped me understand the true value of data and leave behind my skepticism for technical analysis:
- Indicators are not absolute truths. Each tells part of the story, and you have to see the pattern in context.
- Consistency beats prediction. Early on, I tried to optimize for “which token would pump next.” That mindset led to overfitting. The engine works best when it’s about understanding the market state, not guessing the future.
- Explainability is key. I had to make every calculation transparent. Users need to see the numbers behind the charts. Otherwise, it feels like magic, and people stop trusting it.
- Automation exposes nuances. Running hundreds of tokens through the same system revealed patterns I would never have noticed manually. For example, volatility spikes often preceded reversals even when RSI didn’t flag anything.
Applying Technical Analysis Daily
This is the part you’re probably here for: how exactly do you use Pump Parade’s AI technical analysis for crypto trading?
Don’t worry, it’s extremely easy, but I felt I had to explain how it works so you understand what you’re seeing when you use it. Now that we’ve covered that, let’s jump in.
Step 1: Select Your Token
Start by choosing the token you want to analyze. Pump Parade supports over 1,000 tokens, each of them packed with data pulled from the blockchain.
Once selected, the system automatically fetches historical price and volume data. Behind the scenes, it calculates all the core indicators:
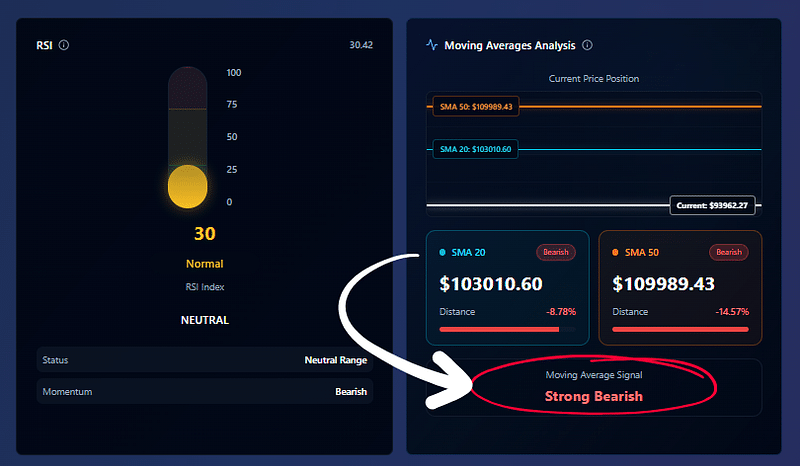
- RSI (Relative Strength Index) for momentum
- 20-day Moving Average (MA) for trend smoothing
- MACD (Moving Average Convergence Divergence) for trend confirmation
- Linear Regression Slope for trend strength
- Volatility to understand risk
- Support and Resistance Levels for realistic price boundaries
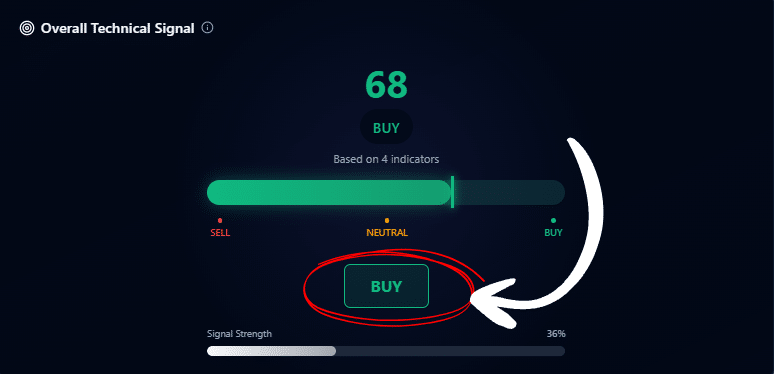
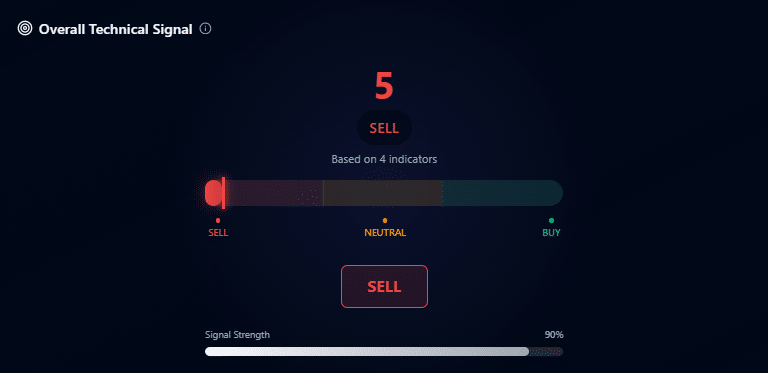
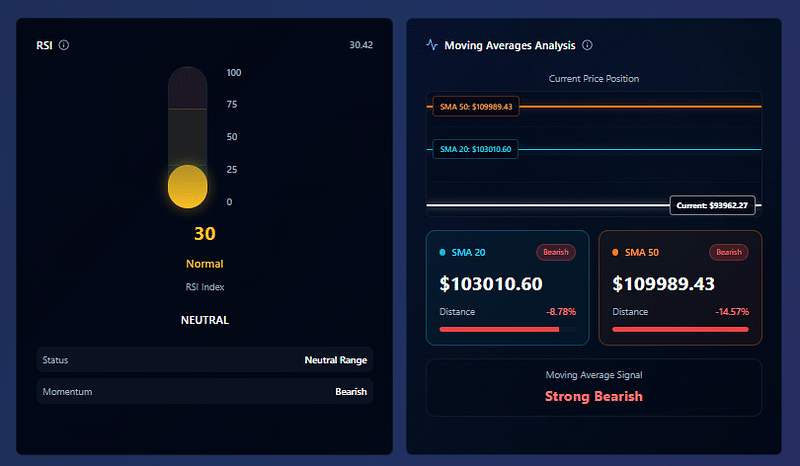
Step 2: Understand the Dashboard Layout
Pump Parade organizes technical indicators in a way that’s easy to digest at a glance:
- Trend Metrics: Shows the current direction, slope, and momentum.
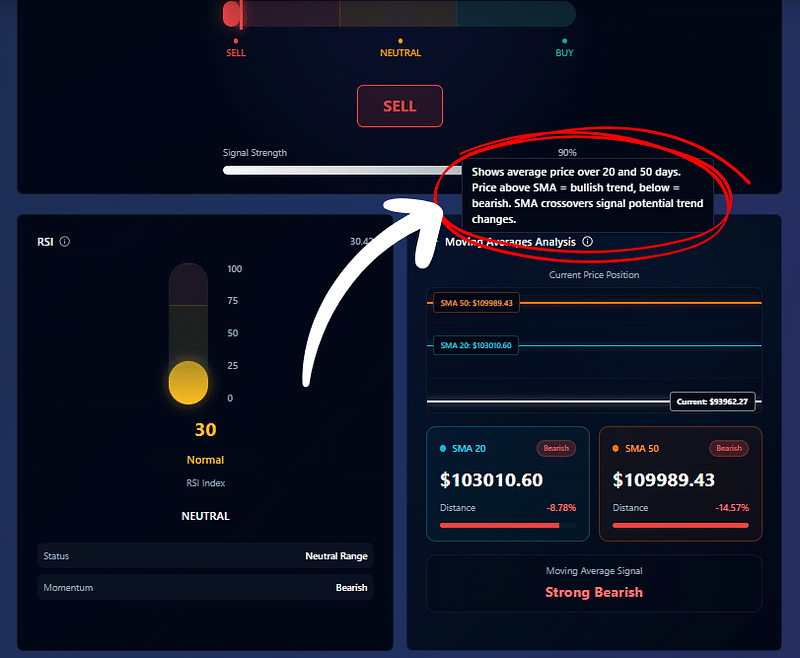
- RSI: Highlighted with color coding: oversold in green (-30), overbought (+70) in red.
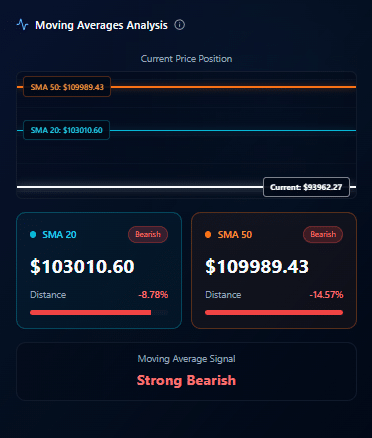
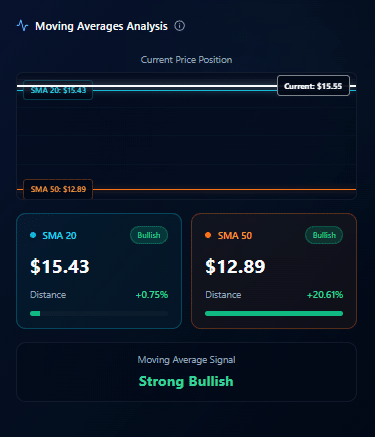
- Moving Averages: Plotted over the price chart, showing trend smoothing.
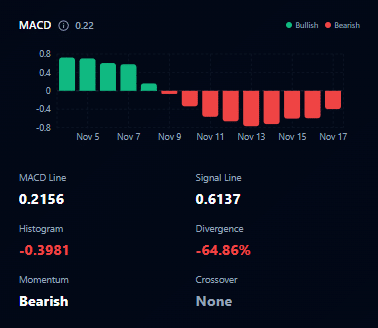
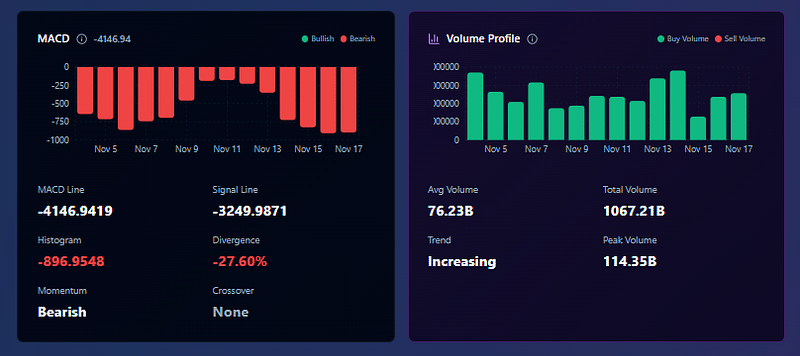
- MACD and Signal Lines: Histogram indicates momentum strength.
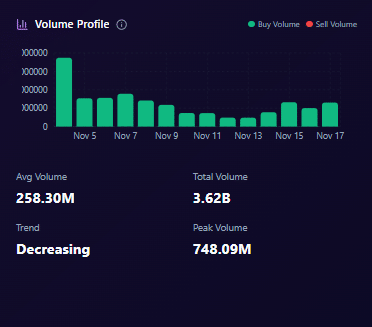
- Volatility Indicator: Visualized as a shading layer or chart overlay.
- Support & Resistance Bands: Highlight likely breakout or bounce zones.
All these are presented in a visually engaging, clear way, with tool tips that explain each chart in case you don’t fully understand what you’re looking at.
Spending a minute reviewing the dashboard before any decision allows you to spot patterns quickly, without diving into raw numbers.
Step 3: Make Data-Driven Decisions
Once all indicators are visible and aligned, I make decisions based on context, not gut feeling:
- Bullish trend + low RSI → strong potential buy
- High volatility near resistance → cautious approach
Pump Parade’s dashboard makes these assessments intuitive. The visualizations and overlays reduce guesswork, letting you focus on interpreting signals instead of hunting for data.
Step 4: Iterate and Observe
Technical analysis isn’t about perfection; it’s about consistent observation.
If you use Pump Parade daily, reviewing indicators, noting trends, and observing how price interacts with signals, over time, you’ll notice patterns that aren’t obvious from price alone.
- RSI extremes rarely cause immediate reversals without trend confirmation
- Support and resistance levels can act as reliable guides for stop-loss placement
Use the tool consistently and you will learn to read the market in a structured, repeatable way, rather than guessing or reacting emotionally.
Tips for Maximizing Pump Parade’s Technical Analysis Tool
Using the technical analysis tool effectively isn’t just about knowing what each indicator does. The real power comes from how you combine and interpret the signals over time.
Technical indicators are tools, not guarantees, and their insights are strongest when viewed together in context. A single metric can be misleading, but a combination reveals trends, momentum, and risk in a way that is actionable and understandable.
Here are some key strategies I’ve learned while building and using the engine:
- Focus on combinations: Don’t make decisions from a single indicator. Look for agreement across RSI, slope, MA, and MACD.
- Always consider volatility: High-risk moves need stricter entry/exit discipline.
- Use support/resistance dynamically: Treat them as zones, not exact numbers.
- Watch trends over time: One snapshot is rarely enough; observe how slope and MA evolve.
- Stay consistent: Daily review builds intuition and reinforces patterns without emotion. Come back every day to adjust your strategy and make better, informed decisions.
These practices turn Pump Parade’s technical analysis from a set of numbers into a framework for understanding the market. Integrating these strategies into your daily workflow will help you see patterns more clearly, spotting potential opportunities earlier, and making decisions with confidence rather than guesswork.
Over time, this approach transforms technical analysis from a theoretical exercise into a practical, disciplined method for navigating crypto markets.
Pump Parade’s AI Technical Analysis tool is free to use and open for everyone. Click here to get started.
What to Look Out for When Using AI Technical Analysis
Technical analysis is not just about running calculations. Crypto moves fast, trends are messy, and indicators can mislead if taken at face value.
Over time, working with the technical analysis engine taught me lessons that no chart or textbook could. These are the insights I wish I had known from day one, and the ones I would pass on to anyone using technical analysis in crypto:
- Never rely on a single indicator: MACD alone doesn’t guarantee trend reversal. RSI alone doesn’t mean buy. Use the combination.
- Volatility changes everything: A high-volatility token with bullish indicators might still swing wildly. Risk assessment is as important as trend assessment.
- Trends can persist longer than expected: Overbought RSI doesn’t always mean immediate correction. Look at slopes and moving averages to gauge trend strength.
- Support and resistance are contextual: A level that held for a few days might break under sudden volume. Adaptive windows work better than static calculations.
The good news is that, instead of relying on memory or gut feeling, Pump Parade’s system flags them automatically.
Over time, it becomes a teacher as much as a tool.
Click here and start analyzing over 1,000 tokens with Pump Parade’s AI Technical Analysis tool!
The Daily Impact
After a few months of using the engine daily, the change was profound.
Decisions became calmer, more deliberate. I stopped chasing hype. I could explain why I entered or avoided a position. The metrics gave me confidence without overconfidence:
- I knew when a token was genuinely oversold instead of just “cheap.”
- I could anticipate where the price might hit resistance or support.
- I had quantitative insight into trend momentum and risk before making moves.
It also revealed the nuances that casual traders often miss. For example: a token might look bullish on price alone, but MACD divergence or flattening MA slopes suggested momentum was weakening. Those subtle signals made the difference between a small win and a loss.
Some Final Tips Before You Start With Pump Parade’s Technical Analysis
If you’re thinking about applying technical analysis in crypto, here’s what I’d suggest based on building and using this engine:
- Combine indicators thoughtfully: Look at RSI, MACD, moving averages, slope, and volatility together. Treat each as a piece of a bigger picture.
- Use context, not absolutes: Indicators are guides, not guarantees. Overbought doesn’t always mean sell; oversold doesn’t always mean buy.
- Track trend strength, not just direction: The slope of moving averages or linear regression is more informative than a simple up/down signal.
- Integrate risk metrics: Volatility should always influence your decisions. High-risk tokens need stricter discipline.
- Visualize patterns: Numbers are helpful, but charts make signals immediately actionable.
- Stay consistent: Build a repeatable process. That’s how you remove emotion from trading.
Closing Thoughts
I went from distrusting technical analysis to relying on it as the backbone of my trading workflow. Not because it predicts the future, but because it reveals the present in a structured, interpretable way.
Pump Parade’s crypto AI engine taught me that the value of technical analysis isn’t in mystical patterns or lucky guesses. It’s in consistency, clarity, and context.
Once you can see the indicators working together reliably, the market stops feeling random and starts making sense.
And that’s the point: technical analysis doesn’t replace judgment. It sharpens it. It doesn’t promise wins. It ensures you’re aware.
For anyone looking to approach crypto with more clarity, the lesson is simple: measure, visualize, contextualize, and let the data guide your decisions, not your gut.
