

Bitcoin is trading at $66,276 as of March 31, 2026. That’s down roughly 35% from its all-time high near $104,000. The Fear & Greed Index sits at 8, deep in “extreme fear” territory. Meanwhile, exactly one year has passed since the April 2024 halving reduced Bitcoin’s daily supply issuance by 50%.
Here’s the thing: if you know crypto history, this setup looks familiar. The 12-to-18-month window after a halving is historically when Bitcoin’s biggest price moves happen. We’re sitting right in the middle of that window. So is this the bottom before the next major rally, or is there more downside ahead? Let’s look at the data.

Bitcoin at a Glance: Key Metrics Today
At time of writing, Bitcoin trades at $66,276 on major exchanges, reflecting a 24-hour decline of approximately 1.7%. Here are the key numbers:
- Current price: $66,276
- Market cap: Approximately $1.31 trillion
- 24-hour trading volume: Over $28 billion globally
- Year-to-date performance: Down roughly 35% from the January 2026 high near $104,000
- Fear & Greed Index: 8 (Extreme Fear)
- Halving date: April 19, 2024. Bitcoin is now in its post-halving expansion window.
On the Solana network, wrapped Bitcoin (cbBTC) is showing $46.9 million in 24-hour trading volume. That’s a sign that Bitcoin demand remains active even across alternative ecosystems. According to CoinGecko, Bitcoin remains the largest cryptocurrency by market cap, commanding over 50% market dominance.
What Happened to Bitcoin? The 2026 Correction Explained
Bitcoin hit a high near $104,000 in January 2026. Since then, it has been in a steady downtrend. Several factors drove the correction.
Macro headwinds. Persistent uncertainty around U.S. fiscal policy, sticky inflation, and a strong dollar put pressure on risk assets across the board. Bitcoin was not immune.
Profit-taking after the post-halving surge. The 2024-2025 post-halving rally was significant. Large holders distributed into strength, creating overhead supply that is still working through the market.
Sentiment collapse. A Fear & Greed Index of 8 reflects the kind of panic that often marks the late stages of a correction, not the beginning. Retail investors tend to sell at bottoms, not tops. This reading is worth paying attention to.
Technical Analysis: Where Does BTC Stand?
Bitcoin’s chart tells a story of compression. Here are the key levels to watch right now.
Support Levels
The most important support zone sits between $58,000 and $62,000. This range has been tested multiple times since the correction began. Every significant dip in Q1 2026 found buyers near $62,000. Below that, the $50,000 to $52,000 zone represents the next major floor. That level held through much of the 2024-2025 accumulation phase.
Resistance Levels
Bitcoin faces layered resistance on the upside. The first hurdle is $72,000 to $75,000, a zone where several failed rally attempts have reversed. Above that, the $80,000 level is a psychological wall. A clean break above $80,000 would change the technical picture significantly. The $100,000 level remains the big target. Psychologically and technically, it aligns with the previous breakout zone from late 2025.
Indicator Readings
The Relative Strength Index (RSI) on Bitcoin’s weekly chart is sitting near 35. That’s not yet at classic oversold territory (below 30) but approaching it. The last two times weekly RSI approached this zone in a bull cycle, BTC staged major reversals within four to six weeks.
The 50-week moving average currently sits near $68,000, just above current price. Bitcoin has spent very little time below this level during the current macro bull cycle. Reclaiming it would be a meaningful signal.
Net short positions have risen 52% in recent weeks, according to derivatives data. This is a double-edged signal: it shows bearish sentiment, but it also sets the stage for a short squeeze if positive catalysts emerge.
The Bull Case: Why BTC Could Rally Sharply from Here
There are several reasons to be constructive on Bitcoin at current levels.
Post-halving timing is favorable. The April 2024 halving cut Bitcoin’s block reward from 6.25 BTC to 3.125 BTC. Historically, Bitcoin’s biggest moves occur 12 to 18 months after a halving. We are now exactly at the 12-month mark. The 2016 and 2020 halving cycles both saw their most explosive gains in this window.
Institutional demand is structural, not cyclical. Spot Bitcoin ETFs absorbed an average of over 1,200 BTC per day in Q1 2026. That’s well above the approximately 450 BTC mined daily. The supply-demand math is straightforwardly bullish on a long enough timeline. Institutions are not panic-selling at Fear and Greed 8.
Extreme fear is historically a contrarian signal. An index reading of 8 is in the bottom percentile of historical readings. The last time the Fear and Greed Index was this low, Bitcoin staged a 60% recovery within three months. Past performance is not a guarantee, but sentiment extremes tend to mean-revert.
Short squeeze potential. A 52% spike in net short positions means a lot of traders are betting against Bitcoin right now. If a positive catalyst arrives, those shorts could unwind rapidly, adding fuel to any rally.
Bull case price target: A recovery to $90,000 to $100,000 by Q3 2026, with a possible extension toward $110,000 to $130,000 by year-end if institutional flows accelerate and macro conditions improve.
The Bear Case: What Could Go Wrong
The bull case is compelling. But a good analysis also asks: what kills the thesis?
Macro deterioration. If the U.S. economy enters a deeper recession, or if central banks stay restrictive longer than expected, risk assets could see another leg down. In this scenario, Bitcoin could retest the $50,000 to $55,000 range. A break below $50,000 would be technically significant and would challenge the bull cycle narrative.
Regulatory risk. The post-election regulatory environment has been relatively friendly in the U.S. But a sudden shift, new restrictions on exchanges, ETF concerns, or a major international crackdown, could remove institutional appetite quickly.
Miner pressure. Post-halving, Bitcoin miners face compressed margins. If Bitcoin stays below $65,000 for extended periods, some miners may be forced to sell holdings to cover costs. Miner capitulation events have historically added downward pressure during corrections.
ETF outflows. The ETF bid has been a structural tailwind. But if institutional sentiment shifts, perhaps due to macro rotation into other assets, ETF outflows could accelerate selling pressure in a way not seen in previous cycles.
Bear case price target: A retest of $50,000 to $55,000 in Q2 2026, with a worst-case scenario in the $42,000 to $45,000 range if multiple bearish catalysts combine.
AI Price Prediction Summary for Bitcoin 2026
Our hybrid AI model combines technical indicators, on-chain data, historical halving cycle patterns, and current market sentiment. Here is what the model outputs at current prices.
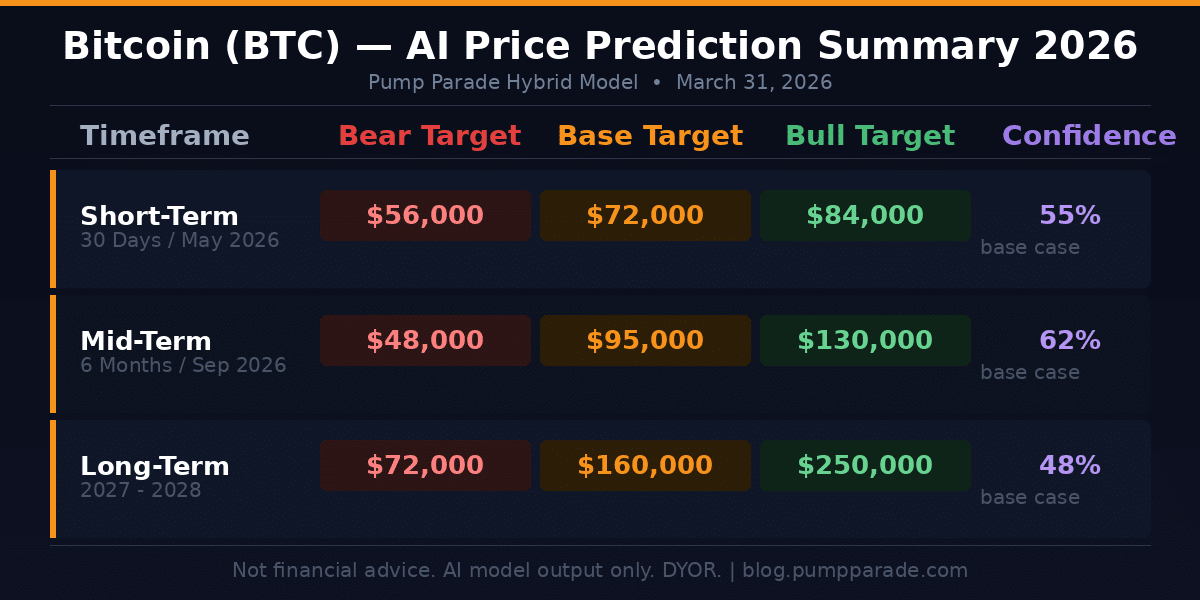
Short-term (30 days, through May 2026):
- Bear target: $56,000
- Base target: $72,000
- Bull target: $84,000
The model assigns a 55% probability to the base case. Bitcoin is in a compression zone. A break above $75,000 or below $62,000 will define the next directional move. The Fear and Greed Index at 8 makes a downside breakdown slightly less likely than it appears. Extreme fear often resolves to the upside over a 30-day horizon.
Medium-term (6 months, through September 2026):
- Bear target: $48,000
- Base target: $95,000
- Bull target: $130,000
The base case reflects a post-halving rally gaining traction by mid-year, supported by ETF inflows and improving macro conditions. At $95,000, Bitcoin would still be trading below its January 2026 all-time high. Conservative, but realistic given the current environment. The bull case of $130,000 requires a short squeeze, macro tailwind, and continued institutional accumulation to all materialize in sequence.
Long-term (2027 to 2028):
- Bear target: $72,000
- Base target: $160,000
- Bull target: $250,000
If the current cycle follows the pattern of 2016-2017 and 2020-2021, the peak comes 18 to 24 months post-halving: roughly Q4 2025 to Q2 2026. But cycles are elongating as Bitcoin’s market cap grows. Our longer-range model, explored in depth in our Bitcoin 2028 price prediction, puts the base case peak in the $160,000 to $250,000 range by the next halving cycle in 2028.
Key Levels and Catalysts to Watch
Here is a practical framework for monitoring Bitcoin’s price action over the next 90 days.
- $62,000: Key support. Holds here, the bull case stays intact.
- $75,000: First major resistance. A weekly close above this level would signal a trend reversal.
- $80,000: Psychological level. Breaking through here would likely trigger the short squeeze scenario.
- $100,000: The big target. Reclaiming six figures would be a definitive signal that the bull cycle is resuming.
- Fear and Greed Index: Watch for a recovery above 25. Historically, the move from Extreme Fear to Fear has been a reliable signal that selling is exhausting itself.
- ETF flow data: Weekly net inflows from U.S. spot ETFs are the most important structural variable to track. Sustained outflows would be a warning sign.
- Halving cycle clock: The 18-month post-halving mark hits October 2025. If history repeats, the window for maximum upside is Q2 to Q4 2026.
Our Take
Bitcoin at $66,000 with extreme fear and 12 months post-halving is, historically, a setup that has rewarded patient, risk-aware positioning. The data says the bull case is more likely than the bear case over a 6-to-12-month horizon. But “more likely” is not “guaranteed.” The macro backdrop is genuinely uncertain. Miner pressure is real. And short-term volatility could take BTC to uncomfortable levels before any sustained recovery.
If you’re watching Bitcoin right now, watch the $62,000 support and the $75,000 resistance. Those two levels will tell you everything you need to know about the next directional move.
Disclaimer: This article is for informational and educational purposes only and should not be construed as financial, investment, or trading advice. Cryptocurrency markets are highly volatile, and past performance does not guarantee future results. The price predictions and analyses presented here are based on AI models, technical indicators, and available data at the time of writing. They are not guarantees. Always conduct your own research (DYOR) and consult with a qualified financial advisor before making any investment decisions. Pump Parade and its authors do not assume liability for financial losses incurred based on information provided in this article.
About our AI predictions: Pump Parade’s price predictions are generated by machine learning models that analyze technical indicators, on-chain data, and market sentiment. These models have limitations and cannot account for black swan events, regulatory changes, or sudden market shifts. Prediction confidence scores reflect the model’s internal assessment, not guaranteed accuracy. Use AI predictions as one input among many in your research.
